Wexford’s development has been shaped by its estuary and the underlying Wexford Granite batholith, which weathers unevenly across the town and its outskirts. The 19th-century land reclamation along the Slaney estuary added layers of soft estuarine silts and peats over the bedrock, creating a complex subsurface that standard boreholes can miss. Seismic tomography becomes essential here because it traces velocity contrasts that reveal hidden channels, buried river terraces, and the irregular granite head before excavation or piling begins. We often combine this with a resistivity survey when saline intrusion along the quays blurs the seismic signal, or with test pits to calibrate the tomographic profile against a physical exposure near Ferrybank. The 2008 flood alleviation scheme demonstrated how critical it is to map these buried paleochannels before any major foundation design.
A seismic velocity contrast of over 1,200 m/s in 50 metres of lateral distance is not unusual near the Slaney’s buried channels — standard borehole spacing would miss it.
Local considerations
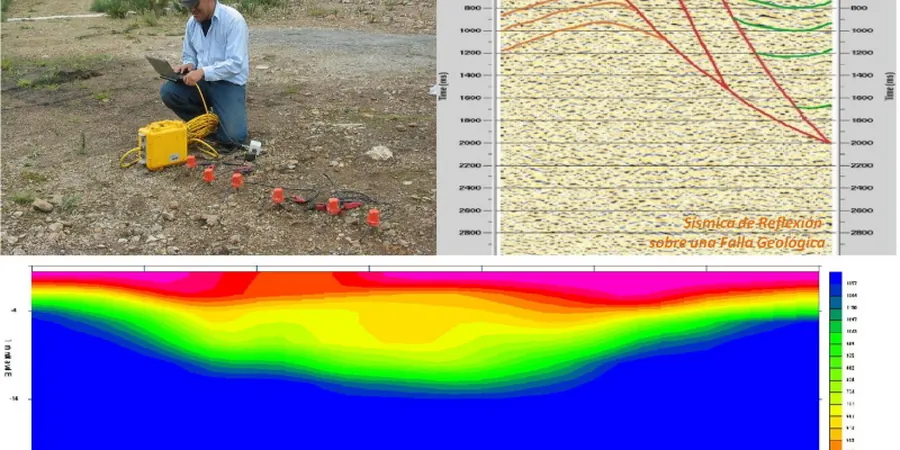
On the quayside projects, we often see that ignoring the low-velocity zones created by the old timber pile fields can lead to differential settlement predictions that are completely wrong. The seismic section will show a velocity inversion — soft saturated organics overlying a stiffer layer — which is a classic signal of buried channels or old dock infrastructure. If this is not resolved before piling, the contractor risks unexpected refusal depths or loss of grout into the channel. In Wexford, where the water table is less than 2 metres below ground level in many areas, the near-surface saturation actually improves the signal-to-noise ratio for P-wave refraction, making the method particularly effective here compared to drier inland sites.
Applicable standards
Eurocode 7 (EN 1997-1:2004) — Geotechnical design, Eurocode 8 — Design of structures for earthquake resistance, Part 5: Foundations, ASTM D5777-18 — Standard Guide for Using the Seismic Refraction Method, ASTM D7128-18 — Standard Guide for Using the Seismic Reflection Method, IS EN ISO 22475-1:2006 — Geotechnical investigation and testing
Frequently asked questions
What is the typical cost of a seismic tomography survey in Wexford?
Depending on the array length, terrain access, and whether we run both refraction and MASW, a typical survey in Wexford ranges from €2.530 to €4.890. Urban sites with high traffic require shorter acquisition windows, which can shift the cost toward the upper end of that range.
How deep can seismic refraction see in Wexford's geology?
With a 115-metre spread and an accelerated weight drop, we routinely image to 30–40 metres in the Wexford tills. Where the granite head is shallow — say 8–12 metres as in parts of Clonard — the resolution is excellent, but the maximum depth is limited by the critical refraction at the bedrock interface.
Can the survey detect karst features in the limestone?
Yes, reflection sections and MASW-derived shear-wave profiles are particularly sensitive to the velocity pull-downs caused by clay-filled cavities. In areas south of Wexford town where the Duncannon limestone subcrops, we have identified several sinkhole-prone zones using combined refraction and reflection tomography.
How quickly are the processed results available?
The field data is processed using first-arrival traveltime tomography within 48 hours of acquisition. A draft P-wave velocity section is delivered within three working days, with the full interpretative report including dynamic moduli following within a week.